Are Your KPIs Driving Growth or
Just Putting on a Show?
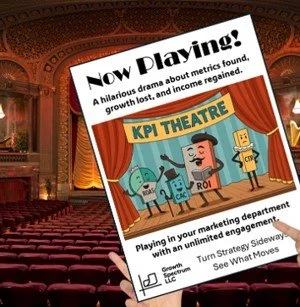
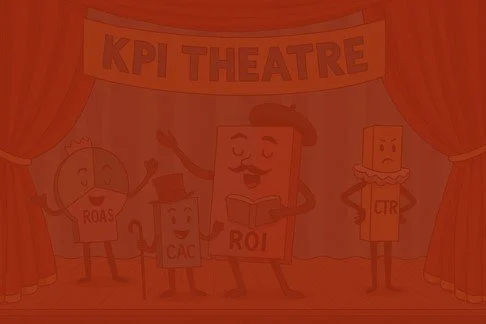
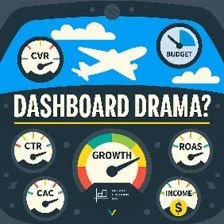
KPI Theatre happens when metrics look impressive but fail to deliver outcomes.
When dashboards perform for the spotlight instead of steering the business, leaders lose clarity, teams lose alignment, and decisions slow down.
KPI Theatre is when metrics perform for the spotlight but don’t move the business forward. It’s vanity dashboards, disconnected data, and activity masquerading as contribution.

What We Mean by KPI Theatre
Leadership presentations with glowing KPIs but declining margins
Marketing reports full of clicks and impressions but no revenue lift
Operations dashboards showing SLA compliance while clients churn
If your metrics look strong but your outcomes don’t, you’re watching KPI Theatre.
Theatre / Arts Managers
click here

How much KPI Theatre is hiding in your business?
Take the free 10-question KPI Theater Diagnostic
Get instant clarity on where your KPI system is aligned, distorted, or silently eroding performance.
Takes 2 minutes
Free personalized report
Immediate insights you can act on.
KPI Theatre wastes time, erodes trust, and hides risk. Leaders make decisions based on numbers that look good but don’t reflect reality.
-
![A smiling man in a suit sitting on an airplane.]()
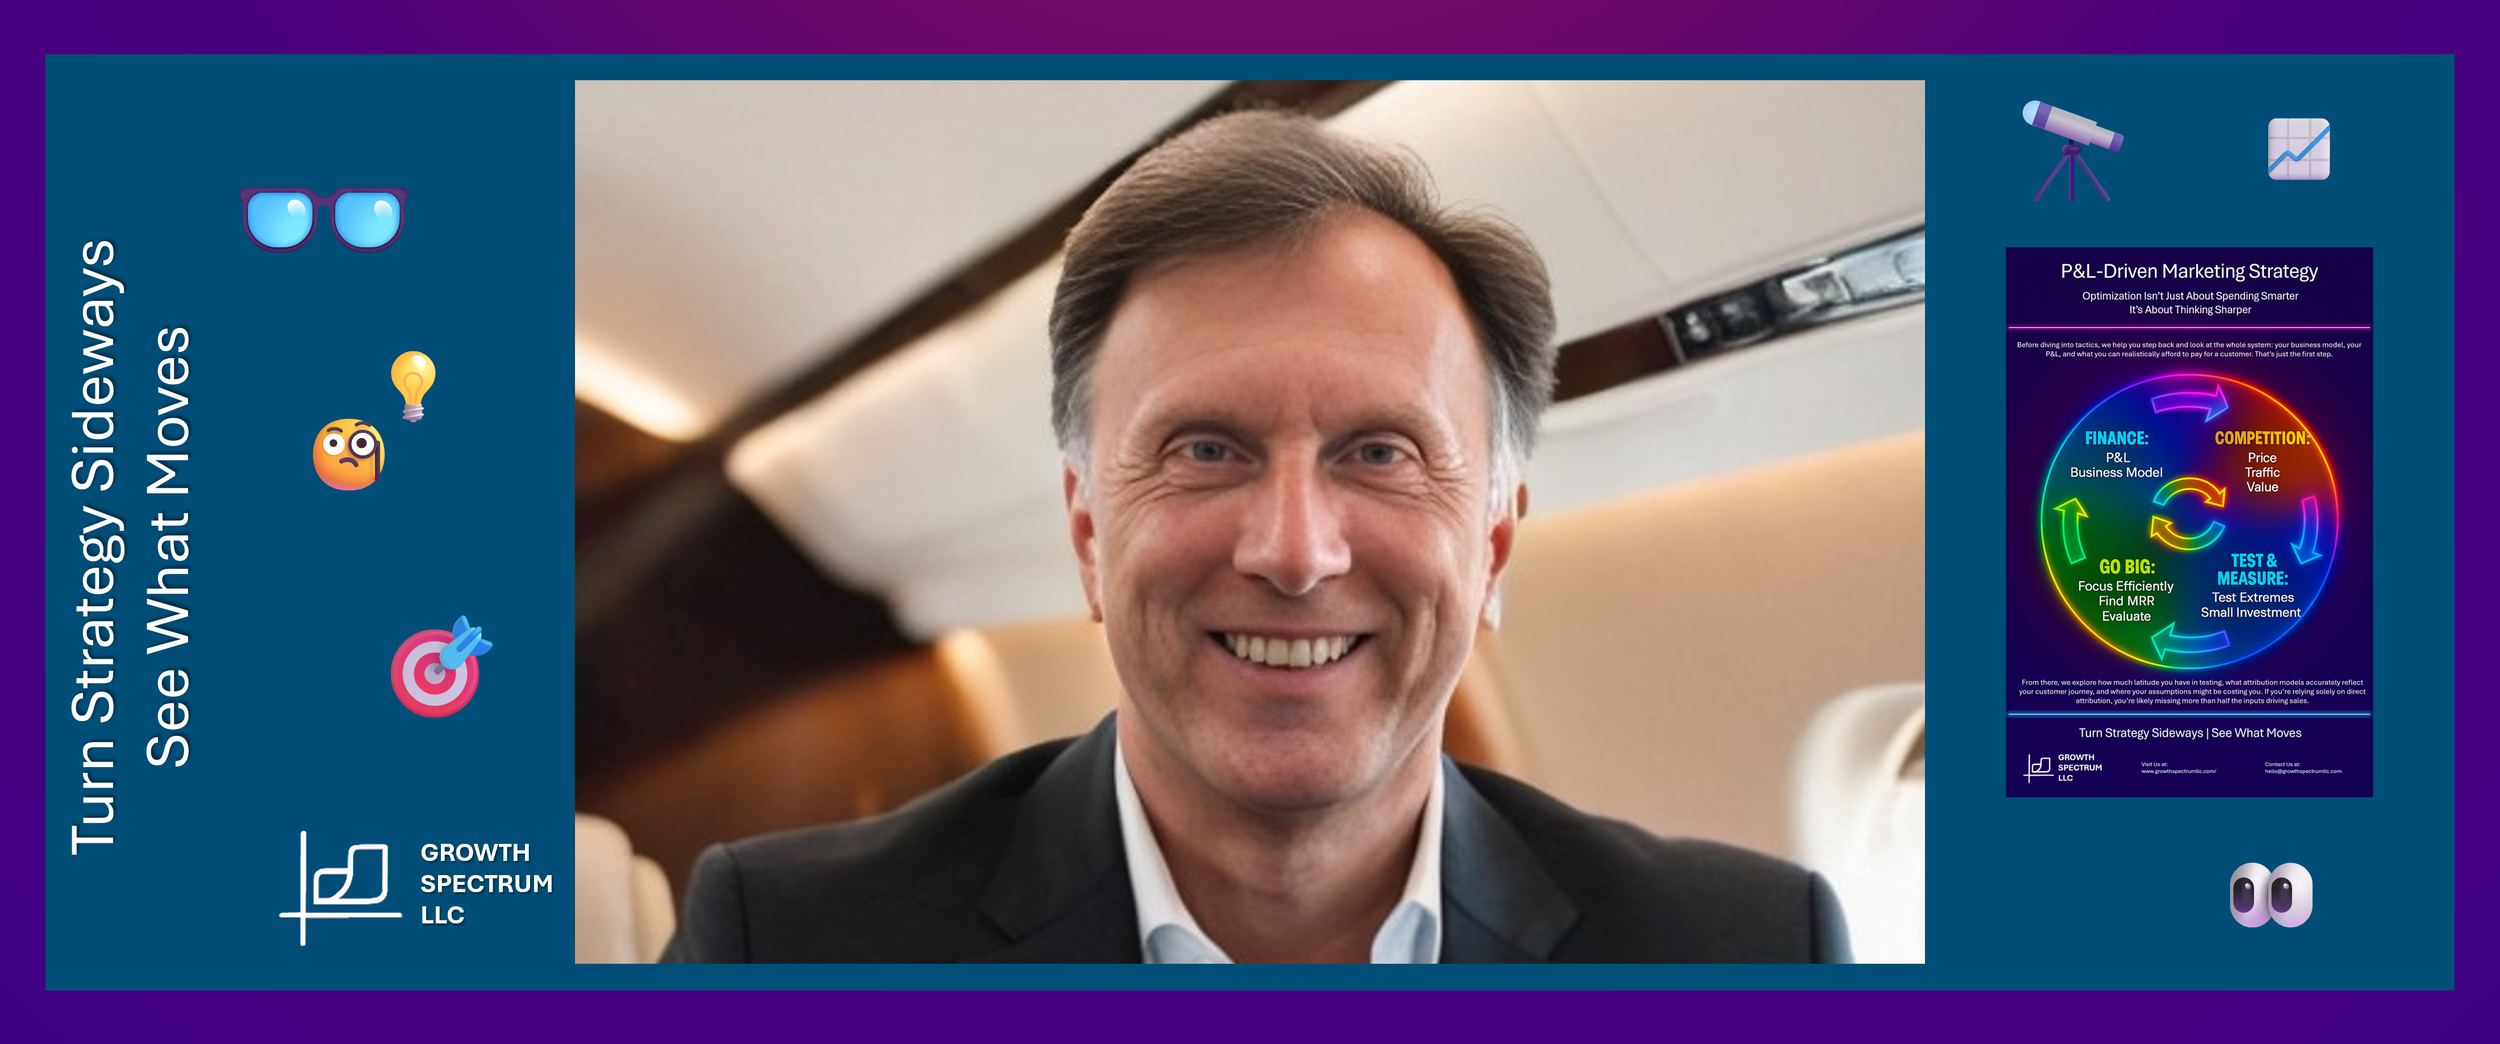
VISION
VANITY TARGETS
When KPIs chase benchmarks instead of business reality, vision gets distorted. CAC and ROAS targets look impressive on slides, but they’re disconnected from margin, contribution, and P&L. The result? Metrics that perform for the boardroom but don’t move the business forward. -
![Promotional graphic with a central portrait of a man with dark hair and beard, wearing a brown jacket and blue turtleneck, outdoor background. Left text: 'Turn Strategy Sideways See What Moves'. Top left icons: crane, lock. Bottom left: logo with a graph and 'Growth Spectrum LLC'. Top right: tools and gear icons. Center right: screenshot of chat conversation. Bottom right: brick wall icon.]()
STRUCTURE
DISCONNECTED DASHBOARDS
Dashboards often pile up data without rhythm or integration. Media spend, demand curves, and ops metrics live in silos. Leaders see numbers, but not systems. Structure breaks down when KPIs entertain executives instead of guiding delivery cadence and operational clarity. -
![A woman smiling while wearing a wide-brimmed hat, with a colorful background and graphics related to leadership models, growth spectrum, and friendly flower icons.]()
CULTURE
ACTIVITY OVER CONTRIBUTION
Teams get rewarded for activity metrics (emails sent, impressions logged, hours tracked) while contribution goes unseen. Culture slips into KPI Theatre when dashboards reinforce busyness instead of outcomes, creating friction and disengagement instead of trust and alignment. -
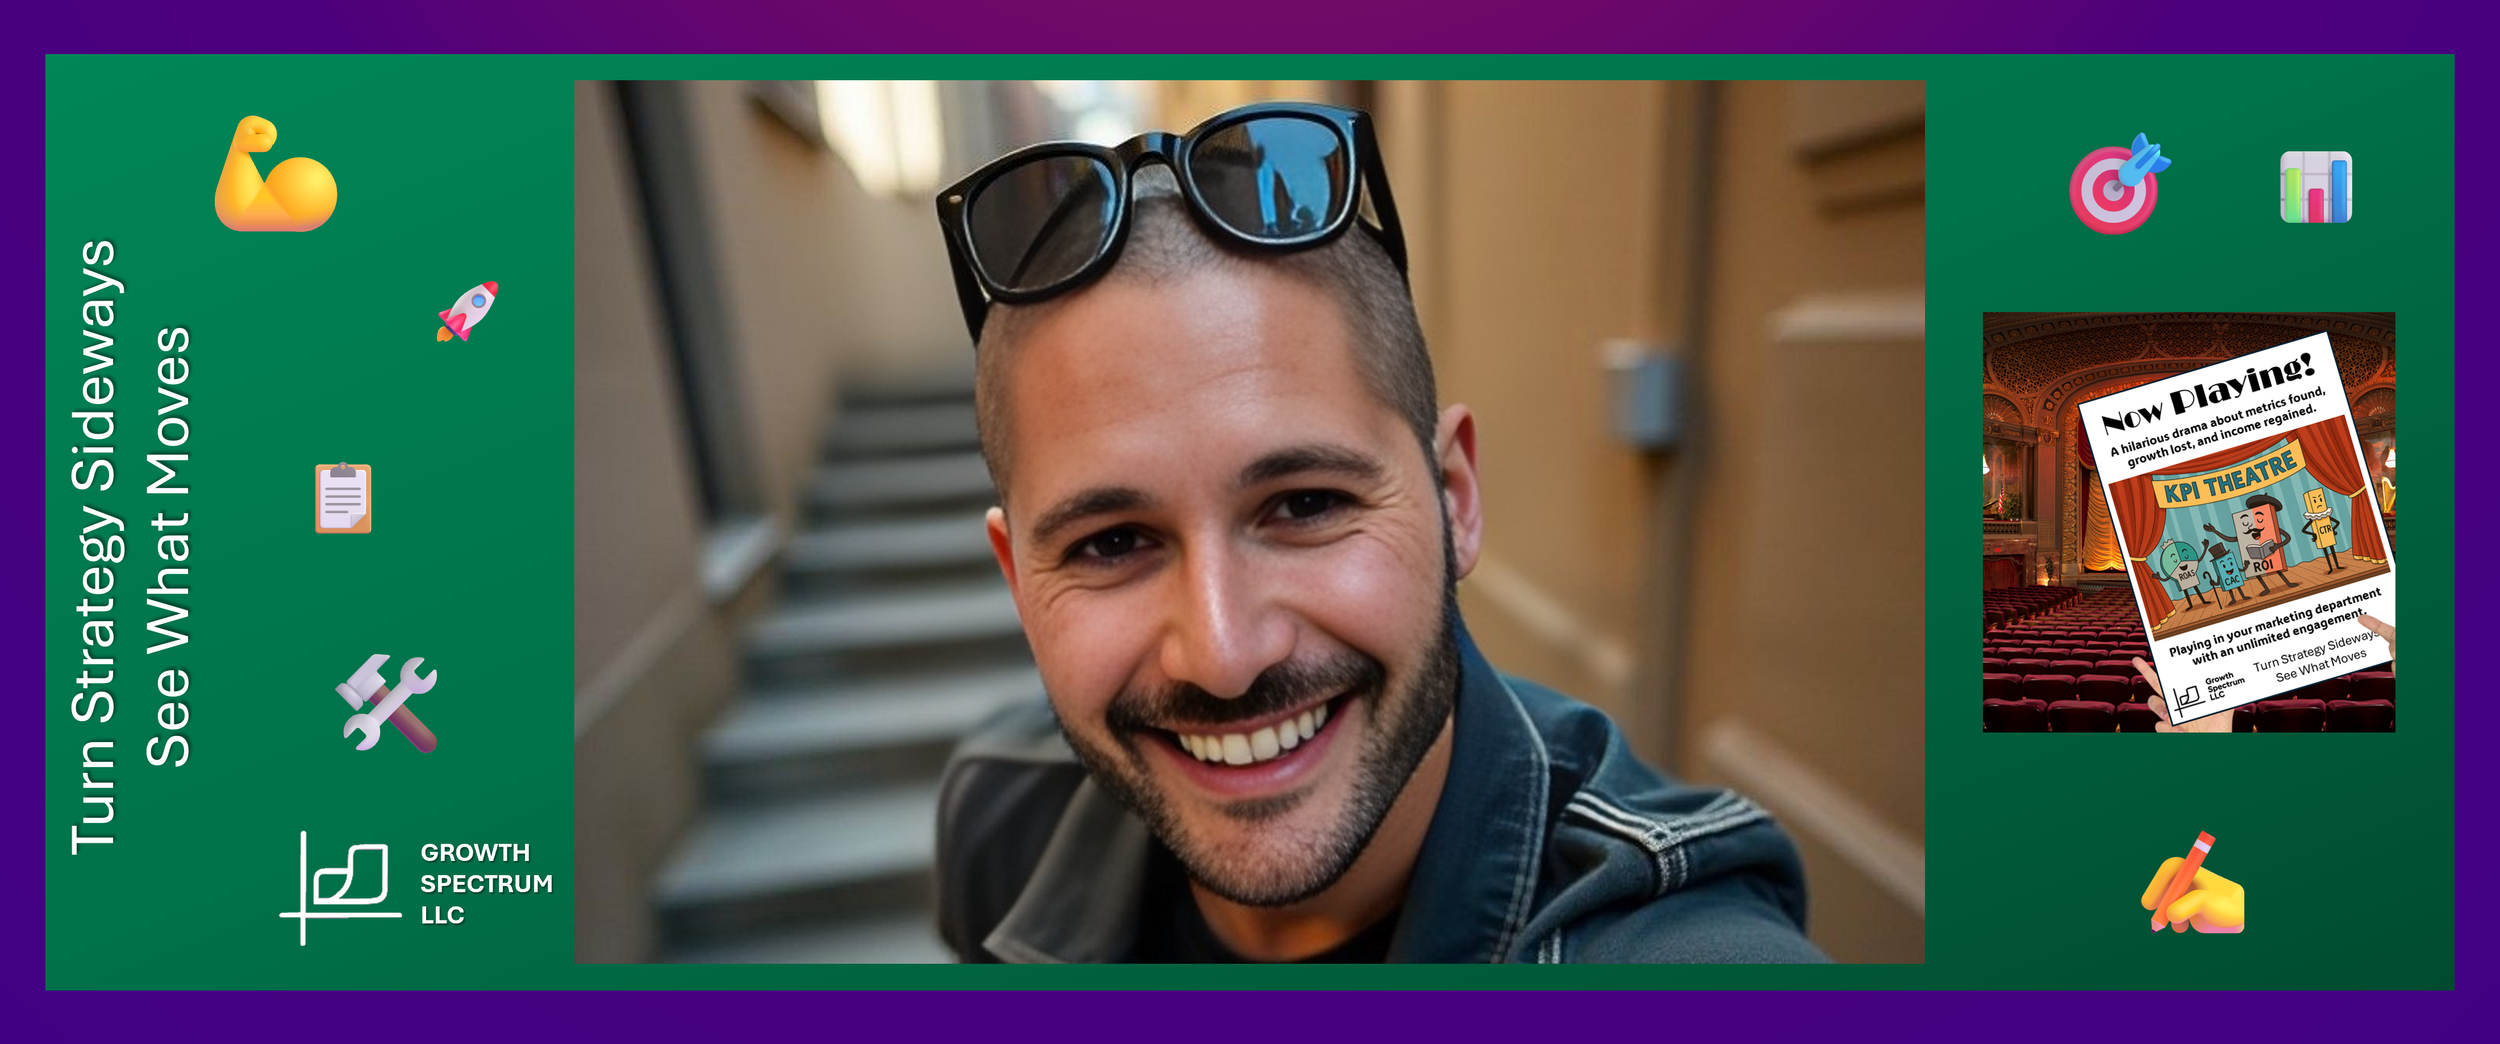
![Portrait of a smiling man with short hair and sunglasses on his head, standing on a staircase in an indoor setting.]()
EXECUTION
BURNED HOURS, MISSED OUTCOMES
Execution KPIs often measure speed or volume without tying back to impact. Campaigns scale prematurely, delivery teams chase utilization, and dashboards celebrate throughput while outcomes stall. KPI Theatre in execution looks like motion without momentum.


Teams optimize for activity instead of contribution. Dashboards become entertainment instead of navigation. You deserve instruments that help you steer, not perform.
Growth Spectrum helps leaders build cockpit‑ready KPI systems:
gauges, indicators, and signals aligned to margin, contribution, sustainability, and risk.
A cockpit tells you:
When the fuel gauge matters
Why tire pressure is relevant
When speed is signal vs. noise
Which instruments matter in which situations
Every metric doesn’t matter all the time. Context determines relevance. Alignment determines performance.
Organize Your KPIs Like a Cockpit
Who We Support
Boards, CEOs, and Founders
Click Here for KPI & Dashboard Solutions
Click Here for Executive Coaching Solutions
CMOs, Sales Directors, and Marketers
Click Here for KPI & Dashboard Solutions
Click Here for Marketing & MarTech Solutions
Operations, PMO, and Delivery
Click Here for KPI & Dashboard Solutions
Click Here for PMO & Delivery Solutions
Theatre and Arts Managers
click here
We have specialized solutions for your unique situation.
Specific Theatre KPI Solutions
What You Can Do With a Healthy KPI System
Align metrics with business outcomes, not internal optics
Reward contribution, not compliance
Build quadrant‑aligned scorecards across Vision, Structure, Culture, and Execution
Coach teams to think like owners, not operators
What We Do
At Growth Spectrum, we help executives and leadership teams:
Diagnose misaligned principal–agent relationships
Reframe metrics around business impact
Build a culture of contribution, experimentation, and strategic clarity
Replace KPI Theatre with KPI Mastery

You’re One Diagnosis Away From Momentum
Take the 10‑question KPI Theatre Diagnostic and see the 20% that will change everything.