
KPI & Decision Systems
Turn Metrics Into Decisions the Business Can Trust
Most organizations don’t lack data. They lack decisions their data can actually support.
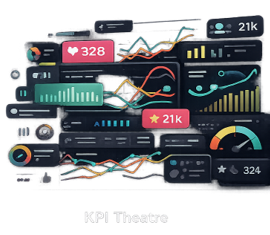
Data alone doesn’t create clarity. Context, integration, and relevance determine whether metrics reveal truth or create KPI Theatre.
Dashboards multiply. Reports become more sophisticated. Metrics look increasingly precise. Yet leadership teams still struggle to answer simple questions:
Are we truly growing?
What decisions will actually improve the system?
Which signals matter and which are noise?
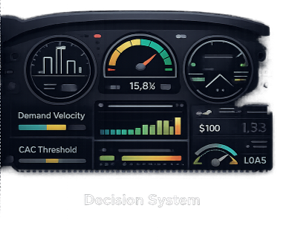
This is the difference between KPI Theatre and Decision Systems. KPI Theatre measures activity. Decision Systems reveal how the business actually works.

Why KPI Systems Fail
Most dashboards are designed for reporting. Not decision-making. They track what is easy to measure rather than what actually drives the system.
Common symptoms include:
KPIs disconnected from margin or contribution
attribution models pretending certainty
dashboards optimized for executive comfort
teams rewarded for protecting metrics instead of revealing truth
optimization inside narrow channels instead of across the business model
When this happens, the organization appears data-driven. But decisions remain reactive.

The Four Dimensions of Decision Clarity
Decision systems must reinforce the same quadrants that stabilize the business.
Vision
KPIs connected to ambition, margin structure, and growth strategy.
Culture
Incentives and reporting norms that reward truth rather than optics.

Structure
Metrics that reveal economic guardrails and operational constraints.
Execution
Operating dashboards that turn signals into action.
When these elements align, metrics accelerate learning. When they don’t, data becomes theatre.

What We Architect
Our role is not simply building dashboards. It is designing the decision infrastructure that allows leadership to understand and steer the business.
That work often includes:
Strategic KPI audits
contribution and margin modeling
decision scorecards
attribution and testing frameworks
dashboard architecture across systems
leadership coaching around metric interpretation
The tools may include SQL, Tableau, Power BI, or marketing platforms. But the value is not the visualization. The value is the decision clarity behind it.

Where Decision Systems Unlock Growth
Decision architecture frequently reveals problems hiding behind good-looking metrics.
For example:
high conversion masking lack of new demand
ROAS targets preventing profitable scale
attribution models hiding brand halo effects
efficiency metrics suppressing experimentation
pricing structures distorting demand signals
These aren’t dashboard problems. They are decision problems disguised as data problems.

From KPI Theatre to Decision Clarity
KPI Theatre creates the illusion of control. Decision Systems create the ability to steer.
When leadership can see the economic and behavioral signals shaping the business, strategy becomes actionable.
And growth stops depending on heroics.

Ready to Move Beyond KPI Theatre?
If Your Metrics Look Good but Decisions Still Feel Unclear
The issue is rarely the dashboard. It’s the system behind it. Explore how KPI & Decision Systems Architecture connects metrics, incentives, and strategy into a decision framework leaders can trust.